Results
At the end of the run, proj-0/systems/final-results/ contains the
usual five files (final.gro, final.top, final.tpx,
final.grx, plus the final.viz.psf/final.viz.tcl pair and a
final.viz.macros.tcl of constituent-keyed selection macros).
Open with:
$ vmd final.viz.psf final.gro -e final.viz.tcl
Because bis-GMA is a built constituent (BPA + 2 HIE joined by
the two param-stage reactions in the YAML), each GMA molecule appears
in the system gro as three residues with their building-block names.
The constituent macros loaded from final.viz.macros.tcl let you
select whole bis-GMAs as one chemical entity — useful for highlighting
the network in the cured snapshot below:
mol modselect 0 top GMA       ;# all 75 bis-GMA molecules
mol modselect 0 top STY       ;# all 150 styrenes
mol modselect 0 top GMA_007   ;# one specific bis-GMA (global molecule index 7)
Plots from the build log
Diagnostic-log plots:
$ htpolynet plots diag --diags diagnostics.log
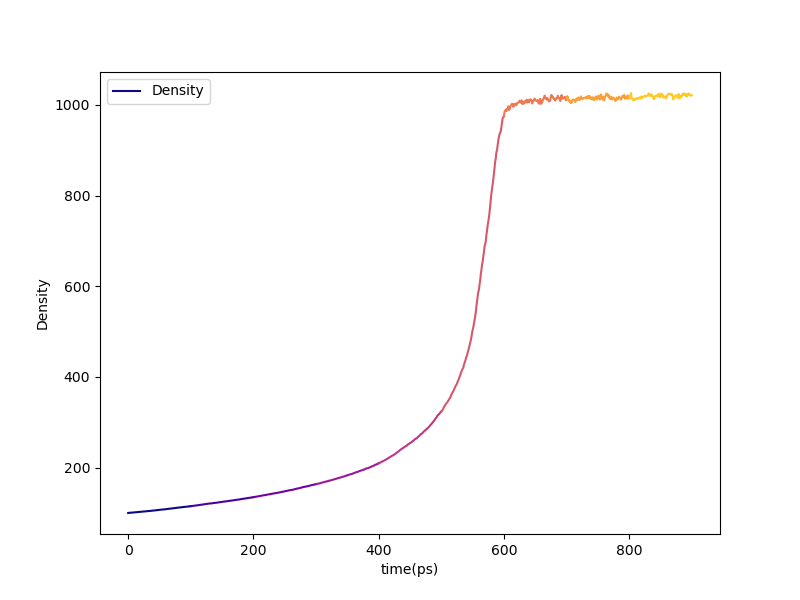
Fig. 14 Density vs. time during the densification stage of the bisGMA/STY
liquid. Each of the eight 100 ps NPT segments is colored
distinctly along the matplotlib plasma colormap.
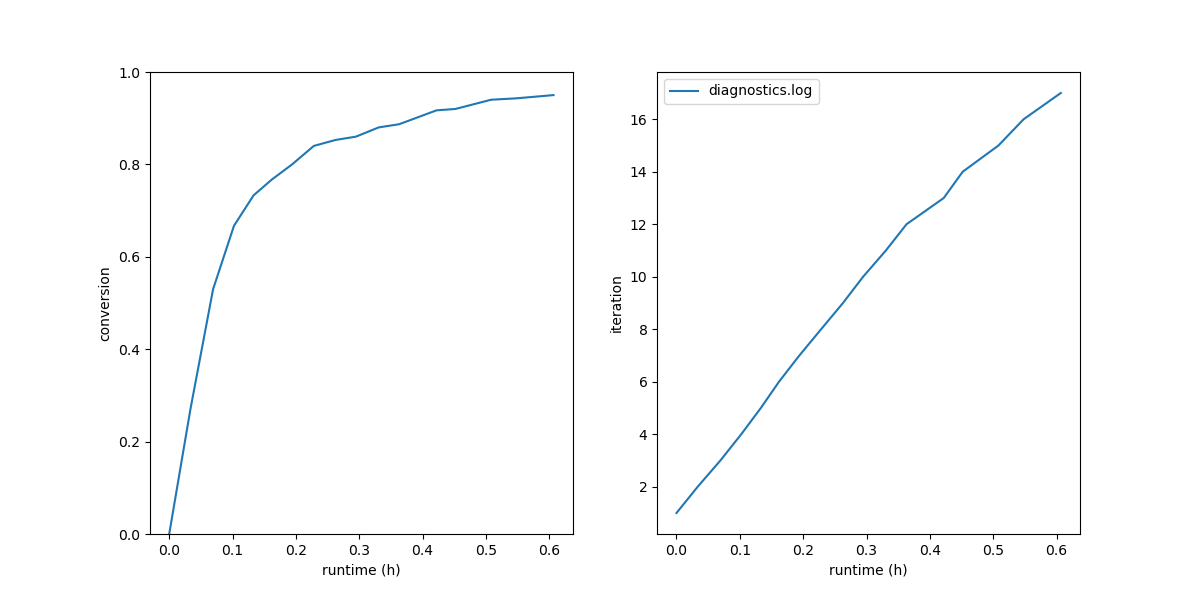
Fig. 15 Cure progress vs. wall time and per-iteration bond yield. Roughly 75 % of the conversion is reached in the first 25 % of the cure wall time — the long tail belongs to the late iterations that pick up only a handful of bonds each.
For a full system-build trace from edr files:
$ htpolynet plots build --proj proj-0 --buildplot t --traces t d p
This walks every edr in the project tree and stitches together the
trace; it takes a few minutes on a moderate-sized build.
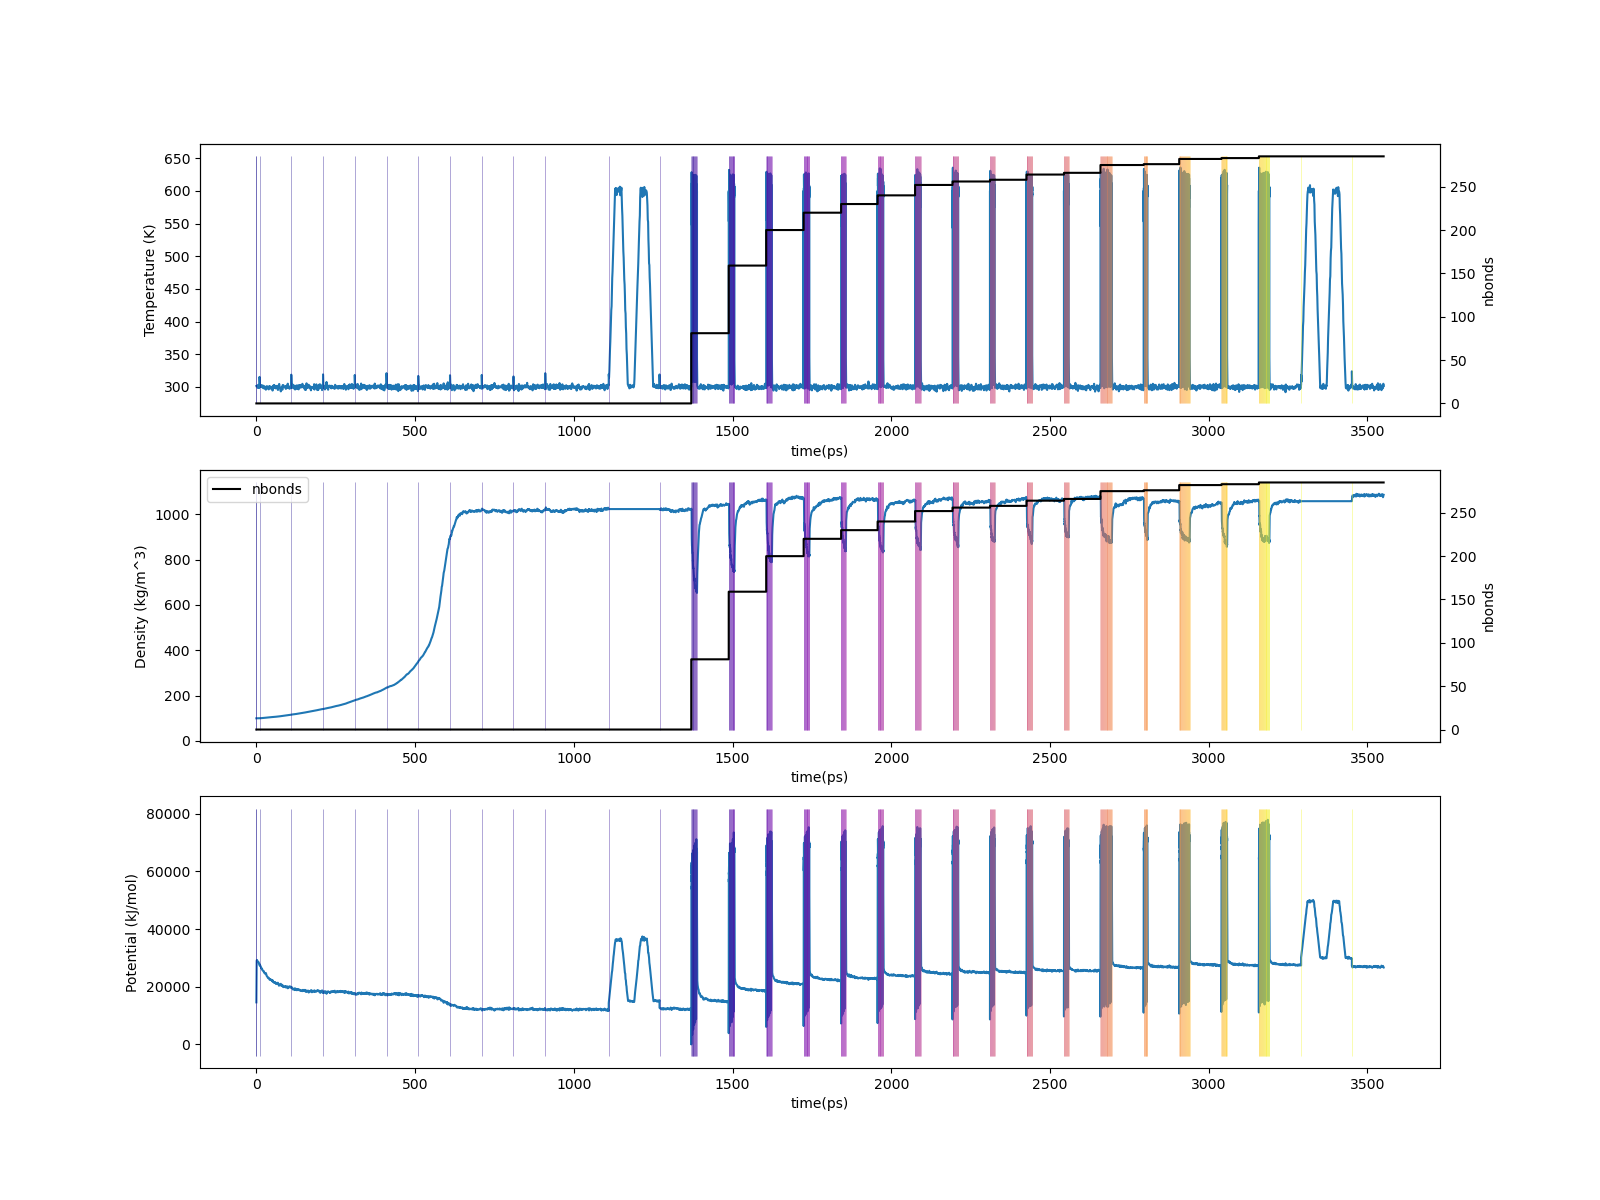
Fig. 16 Top: temperature vs. time for the 95 % cure of bisGMA/STY. Middle: density vs. time, overlaid with cumulative bond count. Bottom: potential energy vs. time.
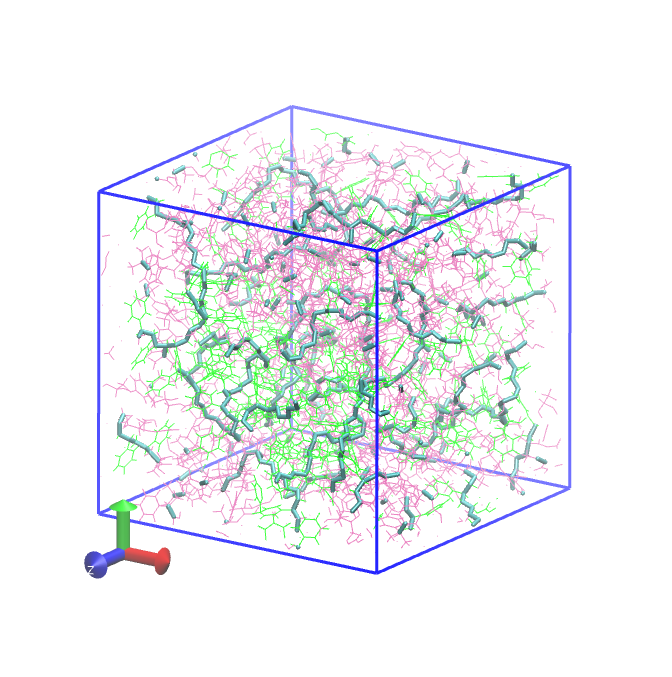
Before and after
Snapshots of the initial liquid and of the cured system, with all
C1–C2 bonds rendered in licorice (intra-monomer in the “before”
panel, intra- + inter-monomer in the “after” panel). GMA molecules are
mauve, STY are green:

Profile
The end-of-run profile report (in console.log and
proj-0/profile.json) shows wall-time and aggregate subprocess time
by stage. In a build like this the setup stage is non-trivial
because of all the chain-expansion templates that have to be
parameterized through AmberTools; expect antechamber and tleap
to take a meaningful share of total wall time alongside gmx-mdrun.