Results
The standard final-results bundle is in
proj-0/systems/final-results/:
$ vmd final.viz.psf final.gro -e final.viz.tcl
Diagnostic-log plots:
$ htpolynet plots diag --diags diagnostics.log
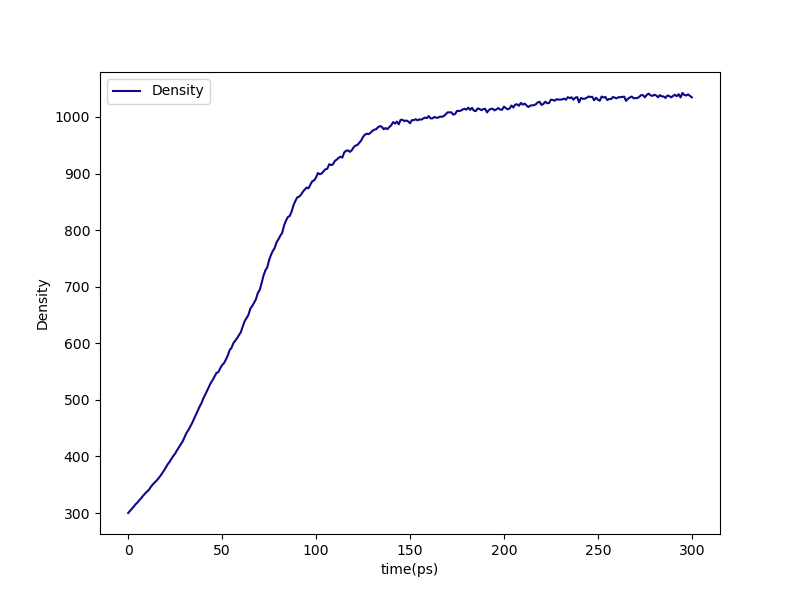
Fig. 19 Density vs. time during the densification of the DGEBA/PACM liquid.
With initial_density: 300 kg/m³ and a single 300 ps NPT segment,
the system reaches roughly ambient polymer density on the first
pass.
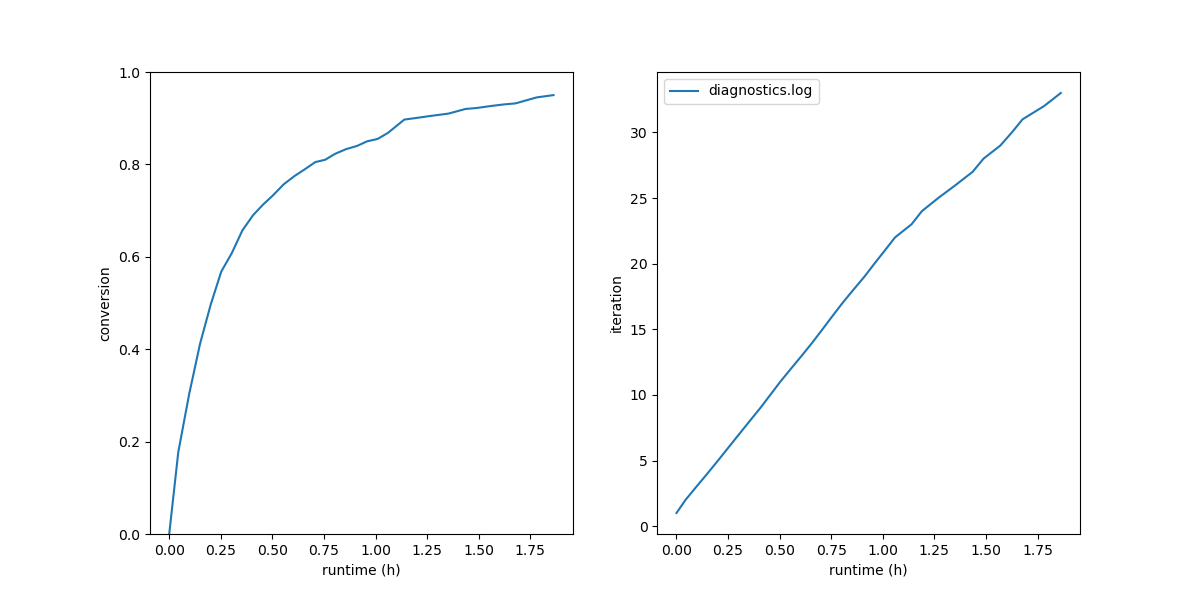
Fig. 20 Left: cure conversion vs. wall-clock. Right: cure iteration index vs. wall-clock. The shape is typical: ~80 % conversion in the first half of the cure wall time, the remaining 20 % takes a comparable amount of wall time because the late iterations find only a handful of bonds each.
For end-to-end traces from edr files:
$ htpolynet plots build --proj proj-0 --buildplot t --traces t d p
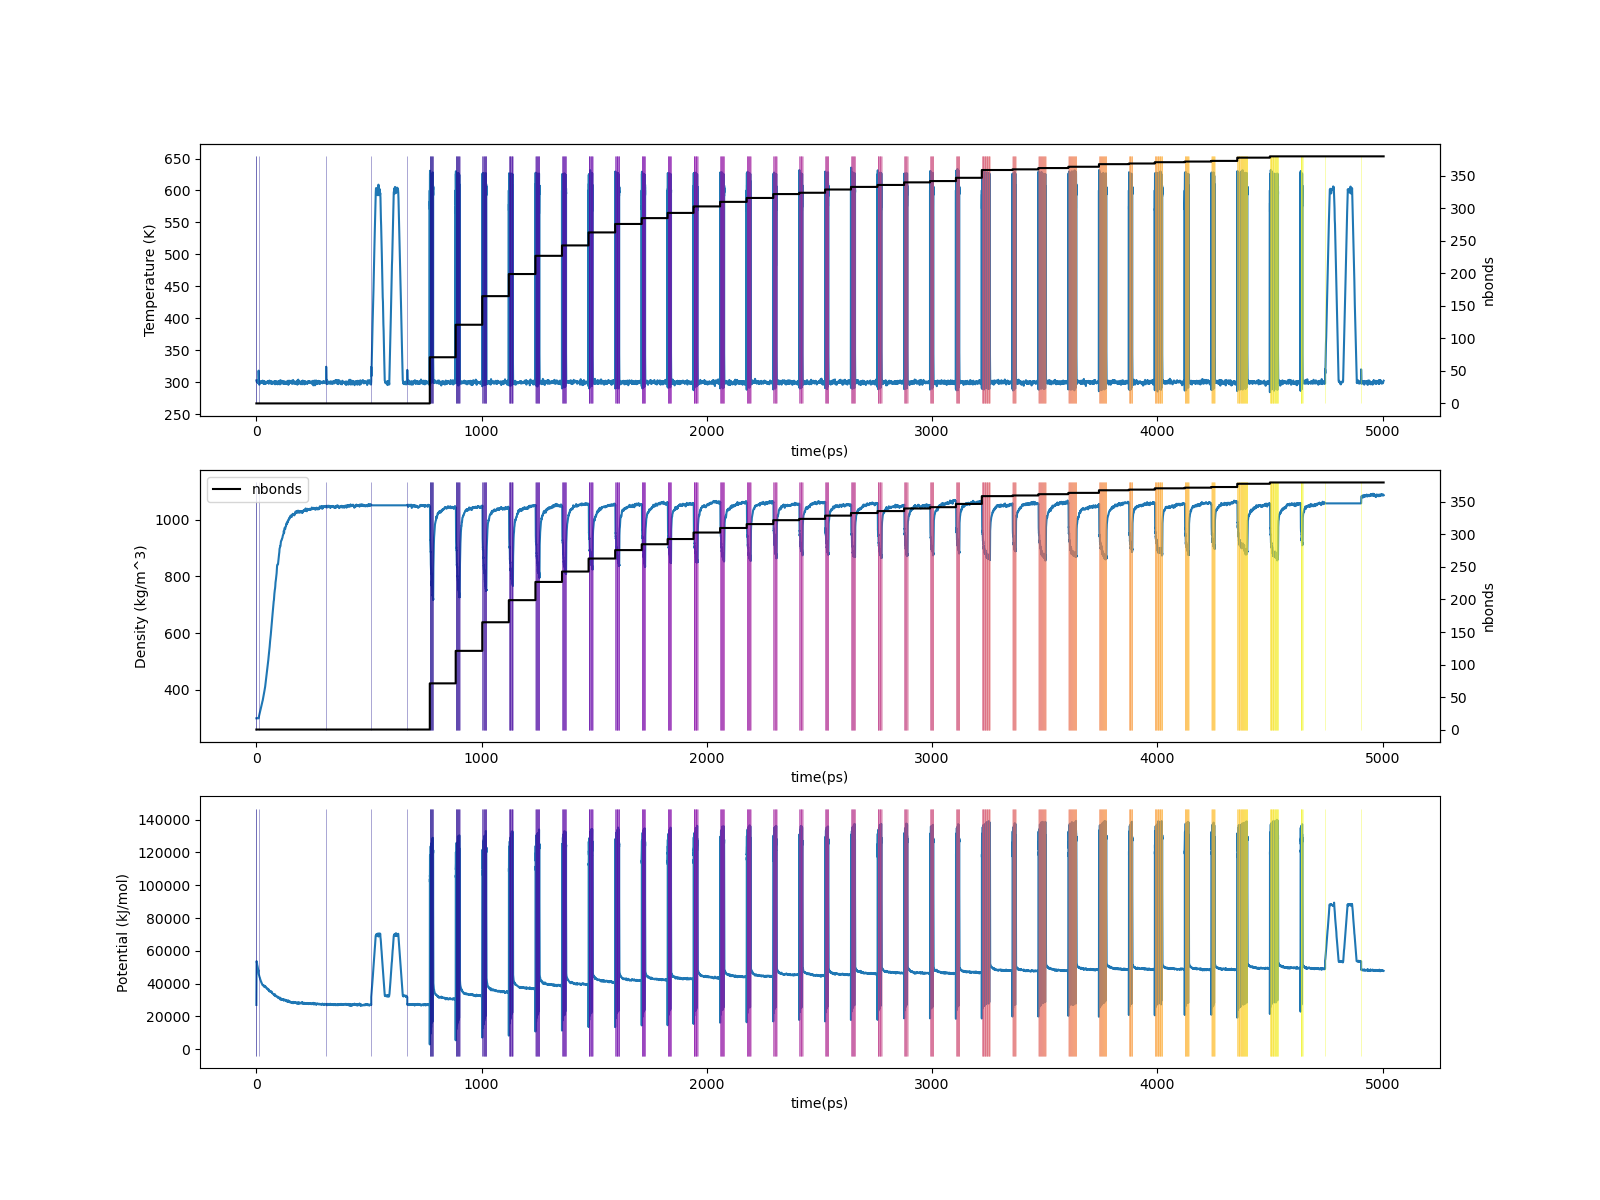
Fig. 21 Top: temperature vs. time across the full build (with cumulative bond count overlaid). Middle: density vs. time. Bottom: potential energy vs. time.
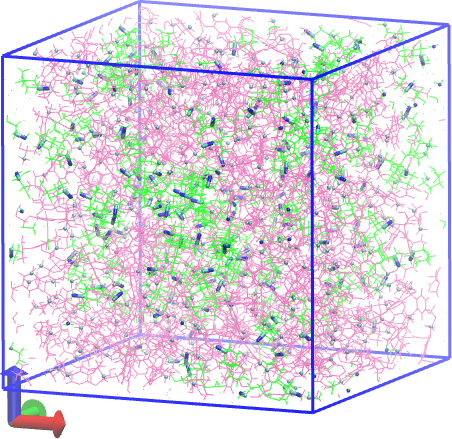
Before and after
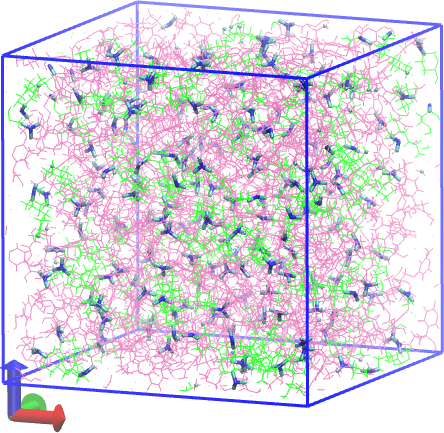
Snapshots of the initial liquid vs. the cured network, with all bonds to crosslink sites rendered in licorice. DGEBA molecules are mauve, PACM are green:
Profile
The end-of-run profile (in console.log and
proj-0/profile.json) shows where the wall time went. In a typical
DGEBA/PACM run, expect:
setup(parameterization of 22 templates) consumes a meaningful share — antechamber + tleap dominate this stage;cureiterations themselves are dominated bygmx-mdrunfor the per-iteration relax + equilibrate cascades;cappingis fast (single iteration over the ~20 leftover oxiranes).
Comparing profile.json between a run with
CURE.controls.min_bonds_per_iteration: 1 and the default
min_bonds_per_iteration: 10 is a useful way to see how the knob
trades iteration count for batch size (the iteration counts measured
on this system are tabulated in Running the Build).